

 Facebook
 X
 Pinterest
 Copy Link
It’s October, which means playoff baseball and the September real estate numbers are both in. One of those is more fun to watch. I’ll let you guess which.
Here is the short version: prices held their ground, buyers have more homes to choose from in all four counties, and mortgage rates climbed back over 7%.
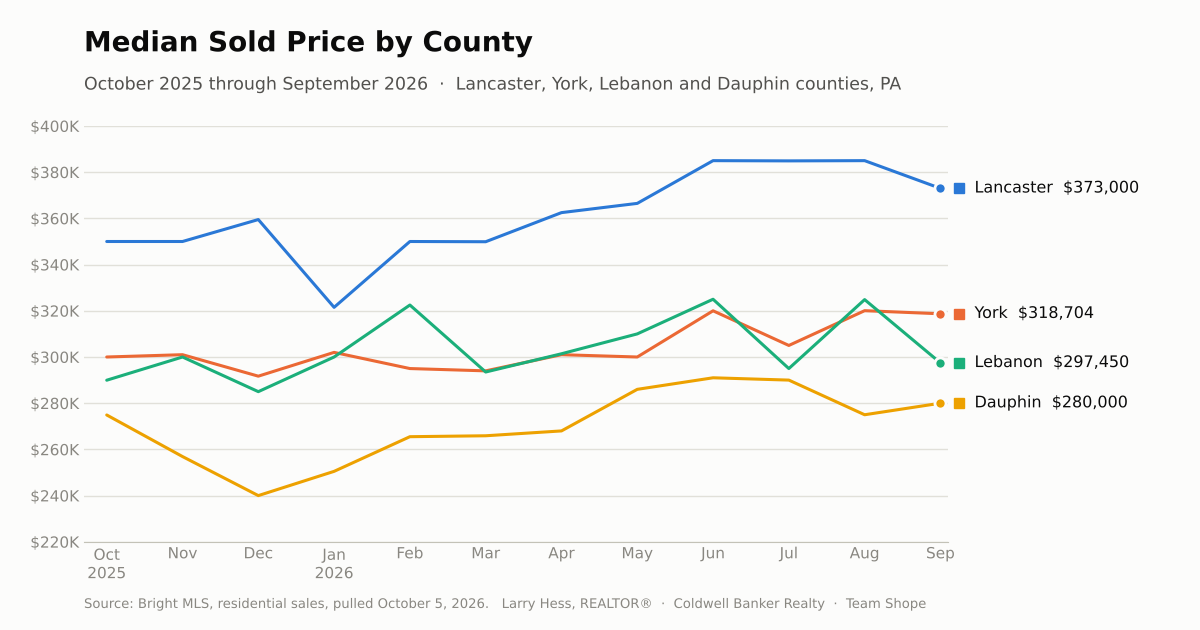
Lancaster County
- Median sold price: $373,000, up 1.6% from last September
- Homes sold: 451, down 0.7%
- Median days on market: 21 (was 25)
- Homes for sale: 785, up 17.0%
- Months of supply: 1.5 (was 1.3)
Lancaster is still the fastest game in town. Homes went under contract in three weeks, even with 17% more of them on the market than a year ago.
Dauphin County
- Median sold price: $280,000, down 1.3% from last September
- Homes sold: 267, down 3.3%
- Median days on market: 28 (was 23)
- Homes for sale: 579, up 10.1%
- Months of supply: 2.2 (was 2.1)
Dauphin is the only one of my four counties where the median price slipped, and it wasn’t by much. Homes are taking about five days longer to sell than last September.
Lebanon County
- Median sold price: $297,450, up 0.8% from last September
- Homes sold: 116, down 17.7%
- Median days on market: 28 (was 27)
- Homes for sale: 413, up 7.0%
- Months of supply: 2.8 (was 2.4)
Lebanon had the biggest drop in sales, with prices basically flat. It also has the most supply of the four, so buyers here have the most room to breathe.
York County
- Median sold price: $318,704, up 12.2% from last September
- Homes sold: 481, down 12.5%
- Median days on market: 24 (same as last year)
- Homes for sale: 1,014, up 6.6%
- Months of supply: 1.9 (was 1.8)
York is the headline. Prices are up about 12% from a year ago, even with fewer homes changing hands.
Mortgage Rates
The 30-year fixed averaged 7.28% the week of October 1, up from 7.03% the week before and 6.34% a year ago. The 15-year fixed averaged 6.60%. Those are national averages from Freddie Mac. Your own rate depends on your loan, credit, and down payment.
What It Means for You
If you are selling: Homes are still going under contract in about three to four weeks, and supply is under three months everywhere I work. That is still a seller’s market. But with more homes for sale than a year ago, buyers can afford to be picky. Price it right on day one and you are in the game. Swing for the fences on price and you may be watching from the dugout.
If you are buying: You have more to pick from than last fall, and that helps. Rates are the tough pitch right now. A 30-year loan averages almost a full point higher than a year ago, so know your monthly number before you fall in love with a house.
If you are downsizing, or helping your parents: Prices are at or near last year’s levels in every county, and York is up about 12%. The equity in a long-time home is still there. A good plan matters more than perfect timing.
Every street is its own ballgame, so county numbers only tell part of the story. You can see the full 12-month history for each county on my Market Update page.
Want to know what these numbers mean for your home?
Larry “Closer” Hess
REALTOR®, SRES, ABR | Licensed since 1995
Coldwell Banker Realty | Team Shope
C. 717.875.0598 | O. 717.534.2442 | larryhessrealtor@gmail.com
County statistics are for residential sales, September 2026 compared with September 2025. Months of supply is the number of homes for sale divided by the month’s pending sales. Source: Bright MLS, pulled October 5, 2026. Mortgage rates: Freddie Mac Primary Mortgage Market Survey, week of October 1, 2026. Information deemed reliable but not guaranteed, and recent figures can change as late sales are reported.
